Design of an Echosounder system - Frequency response measurement of a piezoelectric transducer
Introduction
Once several ultrasonic transducers have been built, it becomes necessary to analyze their behavior to ensure that the piezoelectric crystals meet the declared specifications.
A first feasible analysis is to measure their frequency response. To achieve this, the sensor must be excited at different frequencies while measuring its equivalent impedance. This will allow us to determine the most suitable frequencies for the transducer’s operation and the power it can transmit to water.
In this post, two transducers will be analyzed: one built using a 4 mm thick piezoelectric crystal with a theoretical resonance frequency of 500 kHz and another using a 10 mm thick piezoelectric crystal with a theoretical resonance frequency of 325 kHz.
Transducer with a 20 mm diameter and 4 mm thick crystal:
![]()
Transducer with a 50 mm diameter and 10 mm thick crystal:
![]()
Diagram and Operation.
The diagram of the system used to obtain the frequency response of sonar transducers is as follows:

The custom sonar controller is used as a signal generator to excite the transducer. Then, a commercial oscilloscope is used to measure the voltage applied to the transducer. The transducer’s current is measured with the oscilloscope by reading the voltage across a serial resistor.
Both the sonar controller and the oscilloscope are connected to a computer to generate the frequency sweep and calculate the impedance.
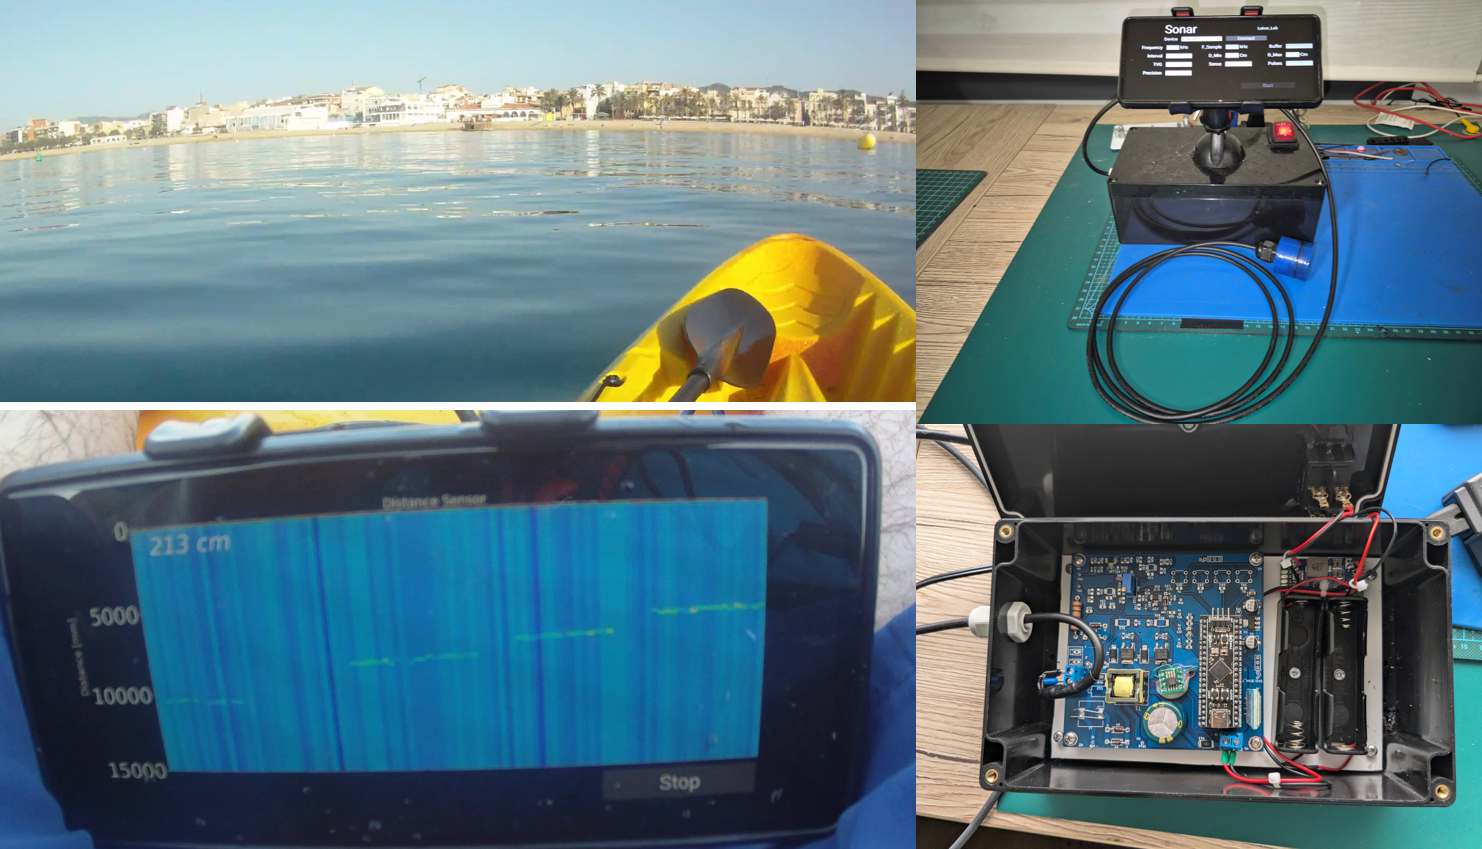
Set up.
The setup for taking the measurements is as follows:

A graphical interface has been programmed in Python using the KIVY framework to automate the process. This software communicates via Bluetooth with the sonar controller board to generate the frequency sweep and through VISA with the oscilloscope to obtain the RMS values of voltage and current.
The measurements are taken with the transducer submerged in a container of water.
Results
The results of the measurements are as follows:
Transducer with a 20 mm diameter:

Transducer with a 50 mm diameter.

In both cases, two main peaks are observed: one at the thickness resonance frequency and another at the radial resonance frequency.
- In the case of the first transducer, the thickness resonance frequency is 510 kHz, and the radial resonance frequency is 100 kHz.
- In the case of the second transducer, the thickness resonance frequency is 325 kHz, and the radial resonance frequency is 40 kHz.
These values match the manufacturer’s specifications and the theoretical calculations. Additionally, other resonance frequencies can be observed, depending on the construction of the piezoelectric crystal.
An important result from the measurement is the resonance impedance of the transducers, which represents the radiation resistance of the transducer in water. From this value, the power transmitted by the transducer to the water can be calculated. The resonance impedance is the impedance at the resonance frequency, which can be approximated to the local minimum in the graph. For example:
- In the case of exciting the 20 mm sensor with a 150 Vrms signal at 510 kHz, the transmitted power would be V 2 /Zres=150 2 /200 =112,5 Watts
- In the case of exciting the 50 mm sensor with a 150 Vrms signal at 325 kHz, the transmitted power would be V 2 /Zres=150 2 /50 =450 Watts.
The impedance resistance of the 50 mm transducer is higher than that of the 20 mm transducer, thus demonstrating that the larger sensor is capable of transmitting more ultrasonic power and, therefore, will have a greater range.
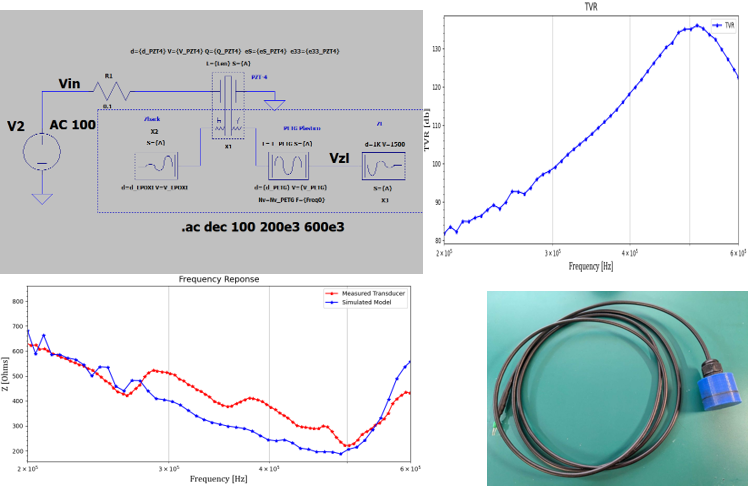
Conclusions and Future Work.
A system has been developed to obtain the frequency response of the sonar transducers. Based on these data, a model of the transducer can be created in the future, and the parameters of an equivalent circuit can be calculated.